So I’ve been looking at creating games using Phaser with TypeScript and I’ve run into my first few annoyances. The first of which is certainly debugging. At first glance debugging looks wonderful then I realized my mistake. In the previous post I said I had to add the generated JS file to the project for a breakpoint to be hit and suddenly I understand why.
You can’t debug TypeScript code in Chrome or Firefox.
Ugh.
If you set a breakpoint in Visual Studio in a TypeScript file:
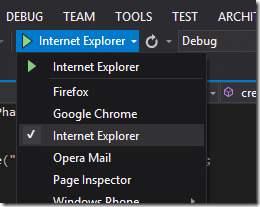
Then run your application using Internet Explorer as the target:
And…
Now switch to Chrome or Firefox and your breakpoint will never be hit.
Well that kinda sucks. At the end of the day it’s not a deal breaker, Internet Explorer is getting better and with Windows Tablets and Phones, should probably be a device target for you, so using Internet Explorer as your debug platform shouldn’t be a huge deal, especially if you are using Visual Studio as your development device.
Debugging TypeScript in Firefox or Chrome
Of course both Firefox and Chrome have built in debuggers so you can easily debug the generated JavaScript. However, if you want to develop in the language your programmed ( be it TypeScript, Dart or Coffeescript ) you need another option…
Source Maps.
All major browsers support source maps now, but may require you to jump through a a couple hoops. A source map is basically what it says, a map from one language to another, so the debugger can run the JavaScript code but show you the line that actually generated it.
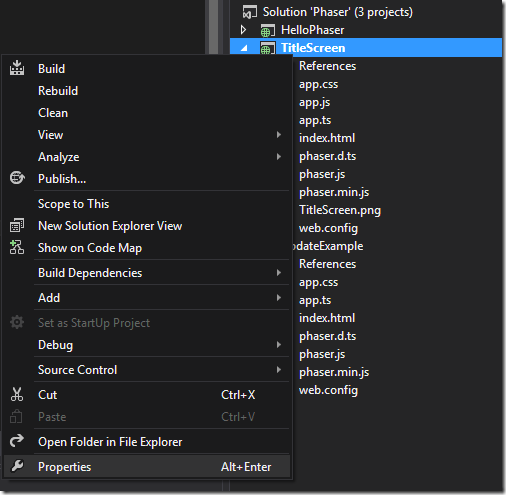
First we need to tell Visual Studio to generate a source map for our TypeScript project. Right click your Project file in Solution Explorer and select Properties.
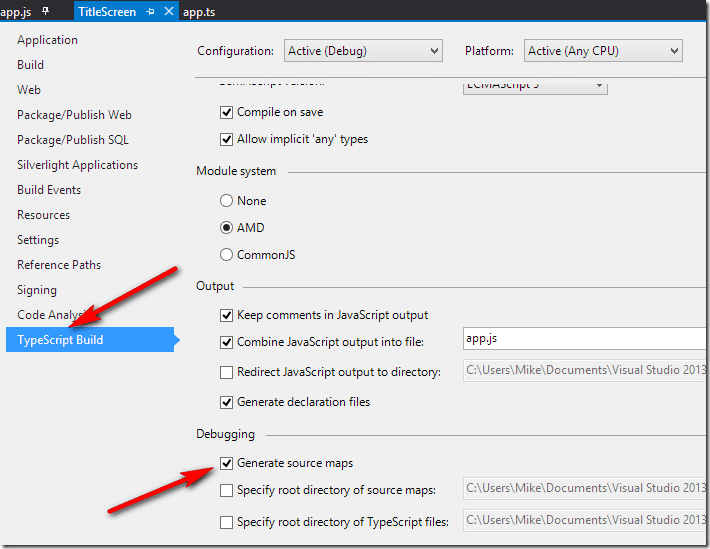
Select TypeScript Build and in the Debugging section check Generate Source Maps.
Now build your project and the js.map file should be generated.
Source map with Chrome and TypeScript
Now let’s take a look at the process in Chrome. Run the project in Chrome from Visual Studio. In Chrome we now need to enable source maps.
Press F12 to bring up the developer tools if not already open.
Select the gear icon.
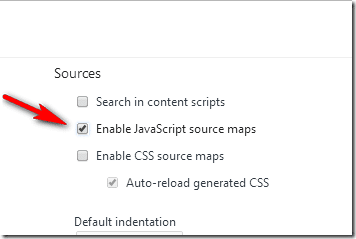
In the resulting window make sure Enable JavaScript source maps.
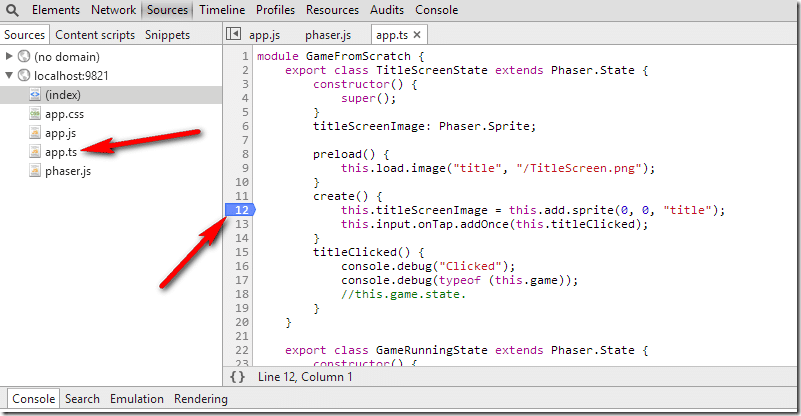
Now you will see your ts files are available in the sources tree. Notice how I set a breakpoint in the TypeScript source ( line 12 )?
Now refresh in Chrome:
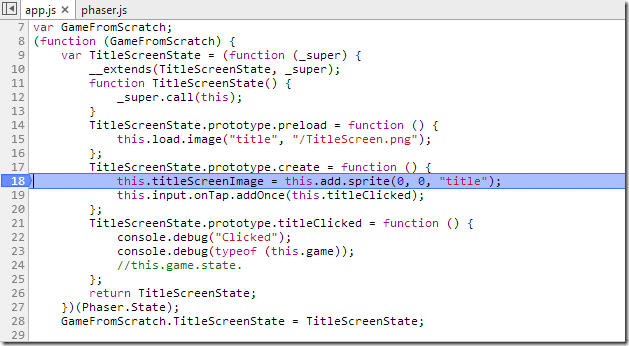
The corresponding line in the generated JavaScript will be triggered when the breakpoint is hit.
Not perfect but definitely better.
Source map with Firefox and TypeScript
From Visual Studio run in Firefox.
Load the Debugger ( CTRL + SHIFT + S or Tools –> Web Developer –> Debugger ).
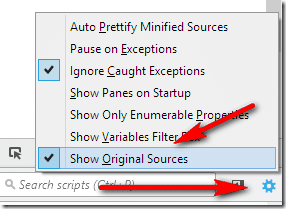
Click the gear icon and now select Show Original Sources
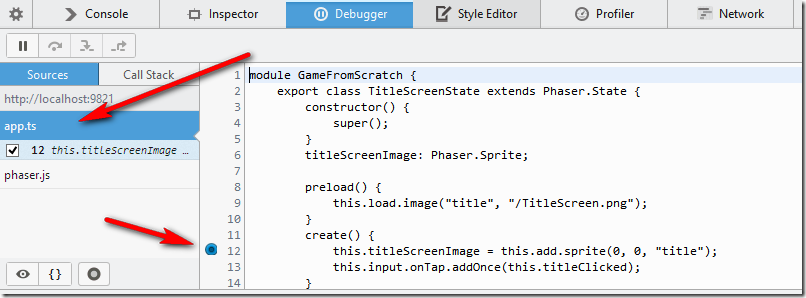
Now Firefox will show your TS source ( and no JS files unlike Chrome, to see them turn Show Original Sources off ). As you can see you can now set a breakpoint in the TypeScript source:
Unlike Chrome however the debugger also works with the TypeScript sources:
Summary and another gotcha!
If you are working in Visual Studio 2013 the VS debugger works flawlessly with Internet Explorer.
If you want to work in another browser with TypeScript use Source Maps if you don’t want to work with the generated JavaScript. In terms of browsers, Firefox supports source maps much better than Chrome does.
Now another gotcha that took me a bit of time to stumble to the solution of. When you create a source map its actually added at the bottom of the generated JavaScript file (app.js in this case), like so:
})(GameFromScratch || (GameFromScratch = {})); //# sourceMappingURL=C:/temp/Phaser/TitleScreen/app.js.map
Here is the gotcha, you absolutely cannot use that pathing in Chrome nor Firefox, you simply wont get a source map in either browser. Instead edit it to use relative paths like:
})(GameFromScratch || (GameFromScratch = {})); //# sourceMappingURL=app.js.map
And you are good to go.


